
To measure student engagement, combine behavioral indicators (attendance, participation, assignment completion), emotional indicators (climate surveys, qualitative feedback), and cognitive indicators (grade progression, autonomy in problem-solving). Cross-reference quantitative platform data with qualitative classroom observation, and revisit the numbers every grading period.
Have you ever left a faculty meeting convinced that "this class has completely checked out" — but couldn't back it up with a single number? Your instinct matters. But without data, it won't move a district-level decision. Across 500+ schools in Brazil and LATAM, we've seen the same pattern: the instructional coordinator who walks into a staff meeting saying "I feel like engagement is slipping" loses the argument to the one who presents a documented 18% drop in assignment completion rates. Measuring engagement means translating what you notice in the hallway into data that drives real intervention. In this guide, you'll find 8 practical indicators — and the tools to track them without drowning in spreadsheets.
Which indicators actually reveal how engaged your students are
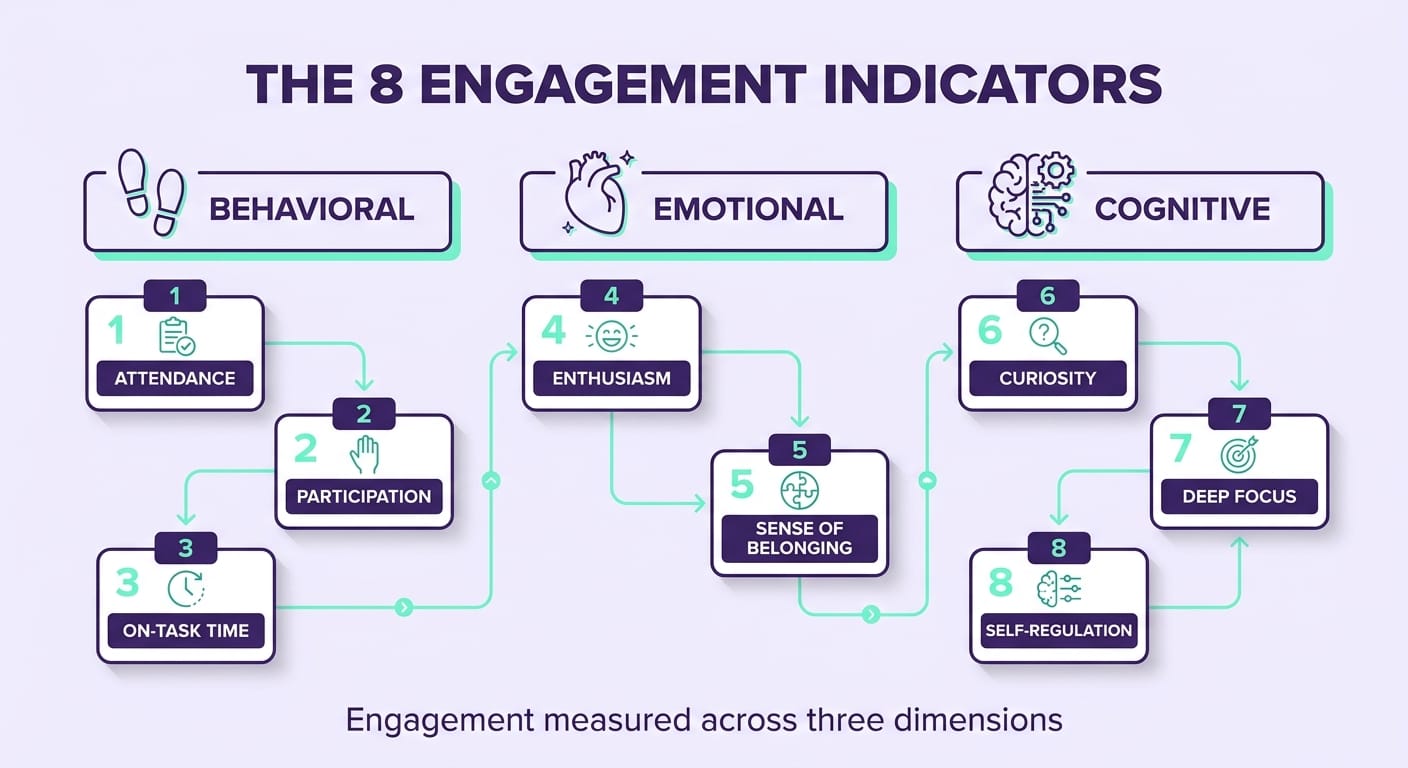
Engagement isn't a single thing. Researchers typically break it into three dimensions, and a reliable diagnosis crosses all three rather than looking at any one in isolation.
Behavioral dimension — what students do, and the easiest to measure:
- Attendance. Repeated absences typically precede dropout by weeks. Working with a school district in the rural Midwest, we found that flagging three consecutive unexcused absences as an automatic prompt for a family outreach call cut the school's dropout rate in half over a single academic year. Track by individual student — not just the class average.
- On-time assignment submission. A student who consistently turned in work and suddenly stops is signaling something, often before any conversation takes place. In practice, this is the earliest warning signal we consistently capture in school dashboards.
- Participation in activities. Raising a hand, posting in a discussion board, contributing to a group project. Measurable even through simple observation logs.
- Time on digital platforms. If your school uses an LMS, access logs reveal exactly who has gone quiet — and who is going deeper.
Emotional dimension — how students feel about being at school:
- Qualitative feedback. Short climate surveys, a single exit-ticket question, a suggestion box by the door. Low cost, high signal.
- Withdrawal and transfer rates. The hardest emotional indicator. By the time it appears on a report, the problem has been building for months.
Cognitive dimension — the intellectual effort students invest:
- Grade progression. Not the absolute score, but the trend line. A student holding steady at a C may be more engaged than one who dropped from an A to a B across two grading periods.
- Autonomy in problem-solving. Students who seek out supplemental resources or ask follow-up questions that go beyond the lesson demonstrate genuine cognitive engagement.
The most common mistake I see in school leadership is measuring only the behavioral dimension — because it's the most visible — and concluding a class is "doing fine" while intellectual curiosity quietly collapses. I observed this firsthand in a 9th-grade math class where attendance was perfect, yet the teacher noticed that no student was asking any deeper questions: cognitive engagement had flatlined without a single behavioral metric triggering an alert. If you want to understand what drives that kind of quiet withdrawal, exploring student engagement strategies is a useful next step.
How to apply the 8 indicators in your school
Don't try to measure everything at once. Instructional leadership teams that attempt to track all 8 indicators in the first month typically abandon the effort by the second — we have seen this repeatedly. The approach that actually sticks follows a deliberate sequence.
Step 1 — Choose 3 indicators to start. We recommend attendance, assignment completion, and one climate survey. Together they cover all three dimensions and are inexpensive to collect.
Step 2 — Establish a baseline. Without knowing today's numbers, you cannot tell whether anything has improved. Record where each class stands before any intervention — this is the step almost every team skips and later regrets.
Step 3 — Set a review cadence. Attendance and submission rates can be checked weekly. Climate surveys and grade progression make more sense on a quarterly schedule — enough time for an intervention to show results before the next review cycle.
Step 4 — Cross-reference the data. A student with near-perfect attendance but falling grades tells a very different story than a chronically absent student. The cross-reference is where the real diagnosis begins.
Step 5 — Act, then re-measure. Collecting data without acting on it is just bureaucracy. Every reading should generate a specific action — and the next measurement confirms whether it worked.
For tools, you don't need anything sophisticated at the start. A shared spreadsheet handles attendance and submissions. Free survey tools cover climate checks. But be honest about the ceiling: spreadsheets work reasonably well for around 5 or 6 classes. The bottleneck surfaces when your school scales — manually cross-referencing data across 30 classes burns the 2 weekly hours a coordinator simply doesn't have, and by the time the data is compiled, it's too stale to drive a timely decision. That is when integrated platforms start earning their investment.
How Gamefik helps schools measure and act on engagement
The problem with manual measurement isn't the data collection itself — it's the lag between identifying a drop and being able to respond to it. By the time you close the end-of-quarter spreadsheet, the at-risk student may have already mentally disengaged for good. An instructional coordinator at a K-12 school put it plainly in a conversation with our team: "I only found out about the problem at the grade-level review meeting — when it was already too late to turn things around."
Platforms built around gamification in education solve this by turning every student action into automatically recorded data. With Gamefik, engagement becomes a live dashboard: you can see in real time who has stopped accessing the platform, who is falling behind on missions, and who is excelling — without opening a spreadsheet every Friday afternoon.
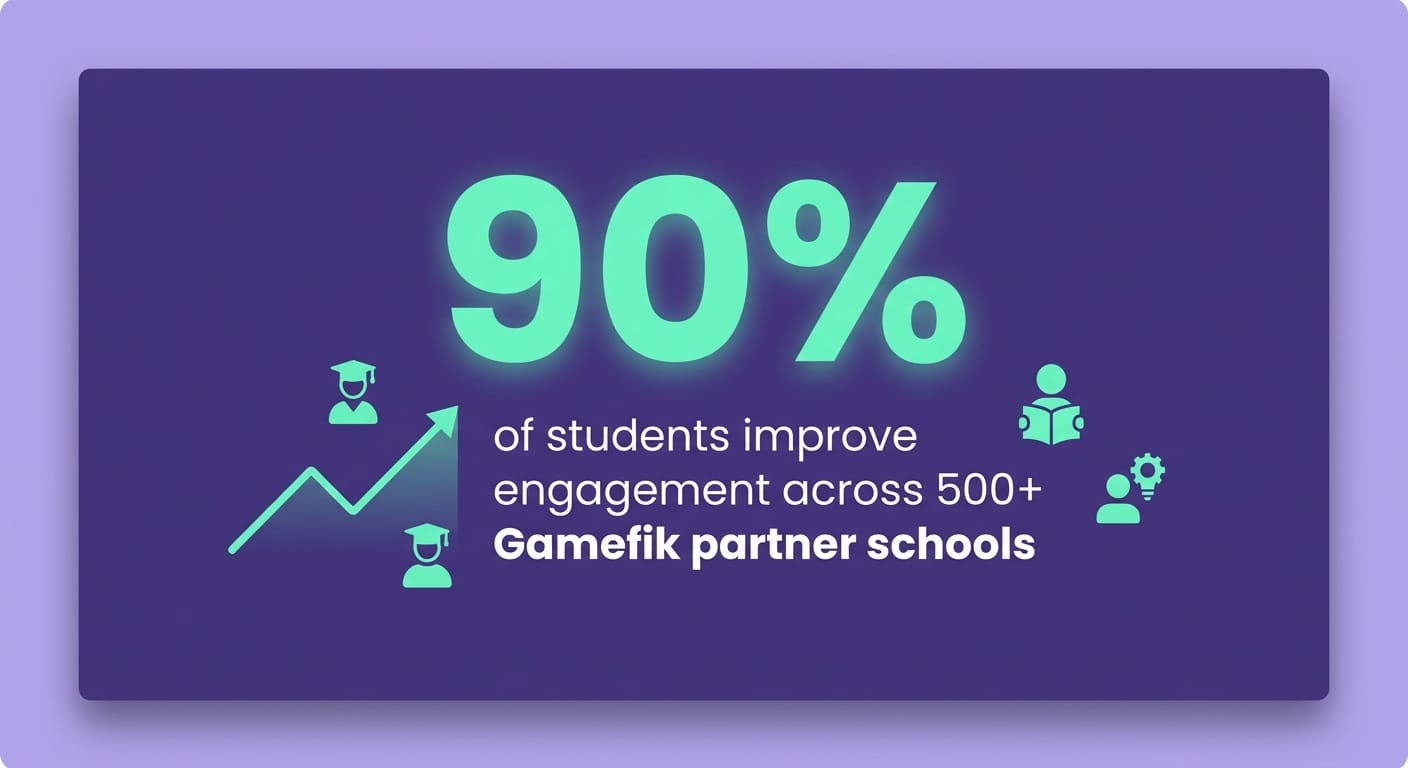
The results from partner schools give a sense of what's possible: 90% average improvement in engagement (Gamefik internal research, 2024) and roughly 2 hours saved per teacher per week that were previously spent on manual data consolidation. This track record spans 500+ schools and more than 100,000 active students across Brazil and LATAM, with full implementation typically completed in under one week.
The artificial intelligence for teachers layer interprets what the numbers mean and surfaces where to intervene first. An honest distinction worth making: content-creation tools solve lesson preparation. Gamefik addresses a different problem — student engagement tracked at the school-wide level, with data that actually sustains instructional decisions. And let's be clear about the prerequisite: the dashboard only delivers value when staff use the platform's activities consistently. Where Gamefik becomes a "Friday afternoon optional," the data stays thin. If you want to deepen your intervention strategies after measuring, the gamified school guide and the student engagement strategies resource complement this diagnostic framework well.
Frequently Asked Questions
What are the main indicators of student engagement? Attendance, participation in activities, on-time assignment submission, grade progression, time on digital platforms, qualitative feedback, withdrawal and transfer rates, and autonomy in problem-solving. Strong diagnoses cross-reference at least three of these rather than examining any single indicator in isolation.
What is the difference between behavioral, emotional, and cognitive engagement? Behavioral engagement measures visible actions such as attendance and assignment completion. Emotional engagement measures how students feel about school. Cognitive engagement measures intellectual effort — autonomy and deeper inquiry. Measuring only one dimension produces an incomplete and often misleading picture.
How often should I measure student engagement? Behavioral indicators like attendance and submission rates can be reviewed weekly. Climate surveys and grade progression make more sense on a quarterly basis, giving instructional teams enough time to implement interventions and observe meaningful change before the next review.
Start measuring for real
If you already know which 3 indicators to track, the next step is choosing where to record them — without spending your afternoons rebuilding the same spreadsheet. Schedule a demo for your school at gamefik.com and see how to turn hallway observations into live dashboards that drive action — before disengagement shows up at your next faculty meeting.