
How to Reduce Student Dropout: Early Warning Diagnostic Framework and 5-Step Retention Plan
To reduce student dropout, track three early warning indicators — attendance below 80%, grade drops across two consecutive assessments, and behavioral disengagement — then apply a 5-step retention plan: diagnosis, family-school contact, individual intervention plan, re-engagement, and follow-up. Schools that build this structured workflow reduce dropout because they act before students leave, not after.
Most resources on student dropout stop right where your problem begins. They explain why students leave, cite national statistics, and close with an appeal to "create a welcoming culture." You walk away as a district administrator or school leader with the same unanswered question: what do I actually do on Monday morning?
This guide is different. Here you will find a diagnostic framework with measurable indicators and a 5-step retention plan that fits inside your semester calendar. No motivational filler — just a working checklist. After 10 years applying gamification across 500+ schools in Brazil and LATAM, we have learned that the bottleneck is never the team's good intentions. It is the absence of a replicable method that survives the pressure of the school quarter.
Why Student Dropout Remains the Biggest Challenge in K-12 Leadership
Student dropout in the United States is not evenly distributed. It concentrates at transition points — middle to high school — and peaks in grades 9 and 10. According to the National Center for Education Statistics (NCES), roughly 5% of 16-to-24-year-olds are out of school and without a diploma, with rates significantly higher among students from low-income households, students of color, and those in rural or underserved districts. In Canada and the UK, the pattern is similar: dropout spikes at key academic transitions and correlates strongly with socioeconomic disadvantage.
This distinction matters for your response strategy. Retaining a 10th grader who needs to work to support their family requires a different intervention than retaining a first-year college student failing introductory calculus. Treating everything as "lack of motivation" is the mistake that costs districts the most. In one Title I high school we worked with, the coordination team discovered that half of all 9th grade absences were concentrated in first and second period — it was a bus route scheduling problem, not disengagement. The wrong diagnosis would have led to a useless intervention.
And costly it is — literally. Every student who drops out represents lost per-pupil funding, an unfilled seat, and a significant increase in the cost of re-enrollment outreach. Retention is always cheaper than recruitment. Yet most schools spend months on enrollment marketing campaigns to replace a student they lost for want of a single family phone call at the right moment.
What "Reducing Student Dropout" Actually Means in Practice
Reducing dropout is not convincing a student to stay after they have already decided to leave. It is a prevention system that identifies risk weeks or months before any formal withdrawal occurs. The difference between a school that retains students and one that loses them is rarely about staff charisma — it is about the capacity to turn signals into alerts, and alerts into action.
In practice, this means three competencies embedded in your school's daily routine:
- Early diagnosis: the ability to read attendance, performance, and behavioral indicators before they become withdrawal.
- Structured intervention: a clear protocol defining who does what when a student enters the risk zone.
- Measurement: defined success metrics to know whether the intervention worked.
Dropout is almost never a sudden event. It is a slow process of disengagement, and each stage leaves a measurable trail. Across 500+ school partnerships, we have consistently found that students who eventually drop out typically show signals two to three months before they disappear from the roster — signals that get lost without a system to capture them. As we outline in our article on student disengagement, this drift begins with engagement, not attendance.
The Early Warning Indicators Nobody Shows You
Here is what sets this guide apart: indicators you can actually measure, not gut feelings. International research on early warning systems converges on three families of signals, known as the ABC model.
A — Attendance. The strongest and most underestimated predictor. The risk does not start at chronic absenteeism — it starts earlier. Monitor:
- Overall attendance below 80% for the grading period.
- Three or more unexcused absences within a single month.
- Absence patterns concentrated on specific days or specific classes (this signals a targeted problem, not a general one).
B — Behavior. Changes that teachers notice but rarely document:
- Declining classroom participation over two consecutive weeks.
- Increasing disciplinary incidents or, on the opposite end, visible withdrawal and apathy.
- Zero assignment submissions for two consecutive weeks.
C — Coursework. The latest signal, but the most unambiguous:
- Grade drops across two consecutive assessments in the same subject.
- Partial failure in more than two courses simultaneously.
- Accumulated grade-level learning gaps (over-age for grade).
The operational rule is straightforward: any student who triggers two or more of these indicators simultaneously enters the retention protocol automatically. Do not wait for a third signal. Do not wait for the next faculty meeting. Two indicators lit up equals immediate action.
A candid limitation worth naming: the behavioral signal (B) is the hardest to capture because it depends on teachers actively recording something they only perceived. A math teacher in 9th grade can feel that a student has "gone dark inside the classroom" weeks before any grade drops — but that perception rarely becomes a data point. The core problem in most schools is not a lack of ABC indicators; it is that they live in three separate places: the teacher's grade book, the attendance office spreadsheet, and the counselor's memory. By the time someone connects the dots, the student is already gone.
How to Apply the 5-Step Retention Plan This Semester
This is the operational core of the guide. Five steps, each with a named owner, a timeline, and a defined success metric. You can run the first cycle within a week.
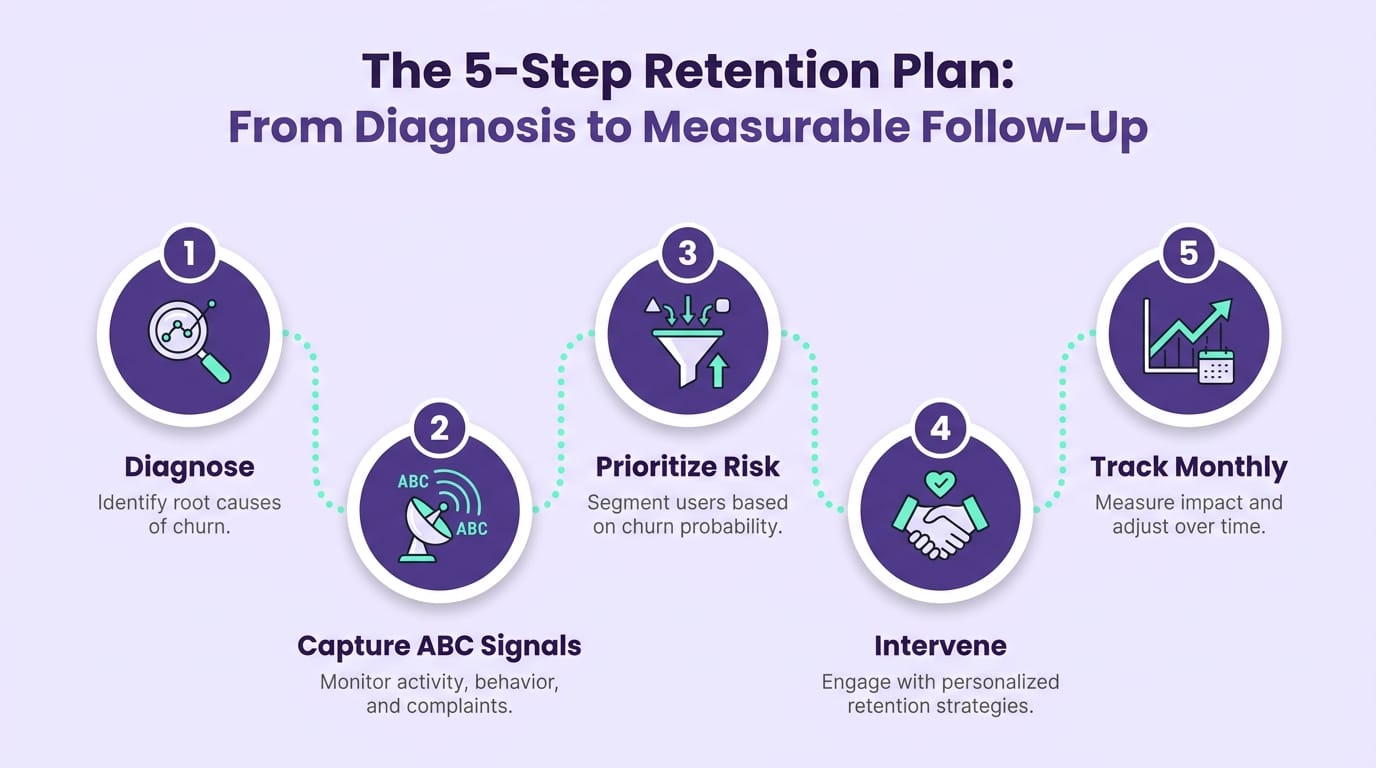
Step 1 — Diagnosis (Week 1). Consolidate ABC indicators across all grade levels into a single dashboard. A shared spreadsheet works to start. List every student triggering two or more signals. Success metric: 100% of at-risk students identified and named.
Step 2 — Family Outreach (Weeks 1–2). For each student on the list, open a direct channel with the family within 5 business days. This is not a punitive summons — it is a diagnostic conversation: what is happening at home, with transportation, with health, with work obligations? Success metric: percentage of families contacted within the deadline. Family-school communication shifts from occasional to protocol-driven. At a bilingual charter school in the Chicago area, changing the tone of this call — from accountability to genuine listening — doubled the rate of families who actually engaged in follow-up. In UK schools, similar results were reported when pastoral leads replaced formal letters with a direct phone call.
Step 3 — Individual Intervention Plan (Week 2). Based on the diagnostic conversation, define a specific intervention for each student: academic tutoring, schedule adjustment, referral to a school counselor or community health resource, or social-emotional support. One student, one plan, one named adult responsible. Success metric: 100% of at-risk students with a documented plan.
Step 4 — Pedagogical Re-engagement (Weeks 2–8). This is where the student starts to feel that school is relevant to their life again. Student engagement strategies that restore agency and a visible sense of progress are critical here — especially for high schoolers, who drop out from boredom just as often as from necessity. In Canadian secondary schools, project-based learning checkpoints tied to visible progress markers have shown strong re-engagement results for this cohort. Success metric: attendance recovering above 85% and assignment submissions resuming.
Step 5 — Ongoing Monitoring (Every Two Weeks, Weeks 2 through End of Term). Revisit the list every 15 days. Who has moved out of the risk zone? Who has deteriorated? Who needs the intervention escalated to district-level support? Without this cadence, every prior effort evaporates. Success metric: the percentage of at-risk students who exited the risk zone and stayed out.
This cycle does not require expensive technology to launch. It requires execution discipline and absolute clarity on who owns what. But here is a prerequisite worth being direct about: without a named individual — a specific counselor, dean, or administrator — responsible for reviewing the list every two weeks, the plan dies at Step 1. The cadence is what separates schools that retain students from schools that only hold meetings about retaining them.
How Gamefik Turns This Framework into an Automatic Routine
The bottleneck of the plan above is always the same: time. Manually consolidating indicators, cross-referencing attendance with engagement data, and re-engaging dozens of students simultaneously consumes hours that school counselors and administrators simply do not have.
This is exactly where a gamified school changes the equation. When engagement is monitored in real time by a platform, the behavioral signals — declining participation, missing assignments, loss of learning momentum — become visible data points on a dashboard before they become dropout. The diagnosis that once took weeks happens continuously. That signal the teacher could "feel" but never recorded appears in the dashboard as a number.
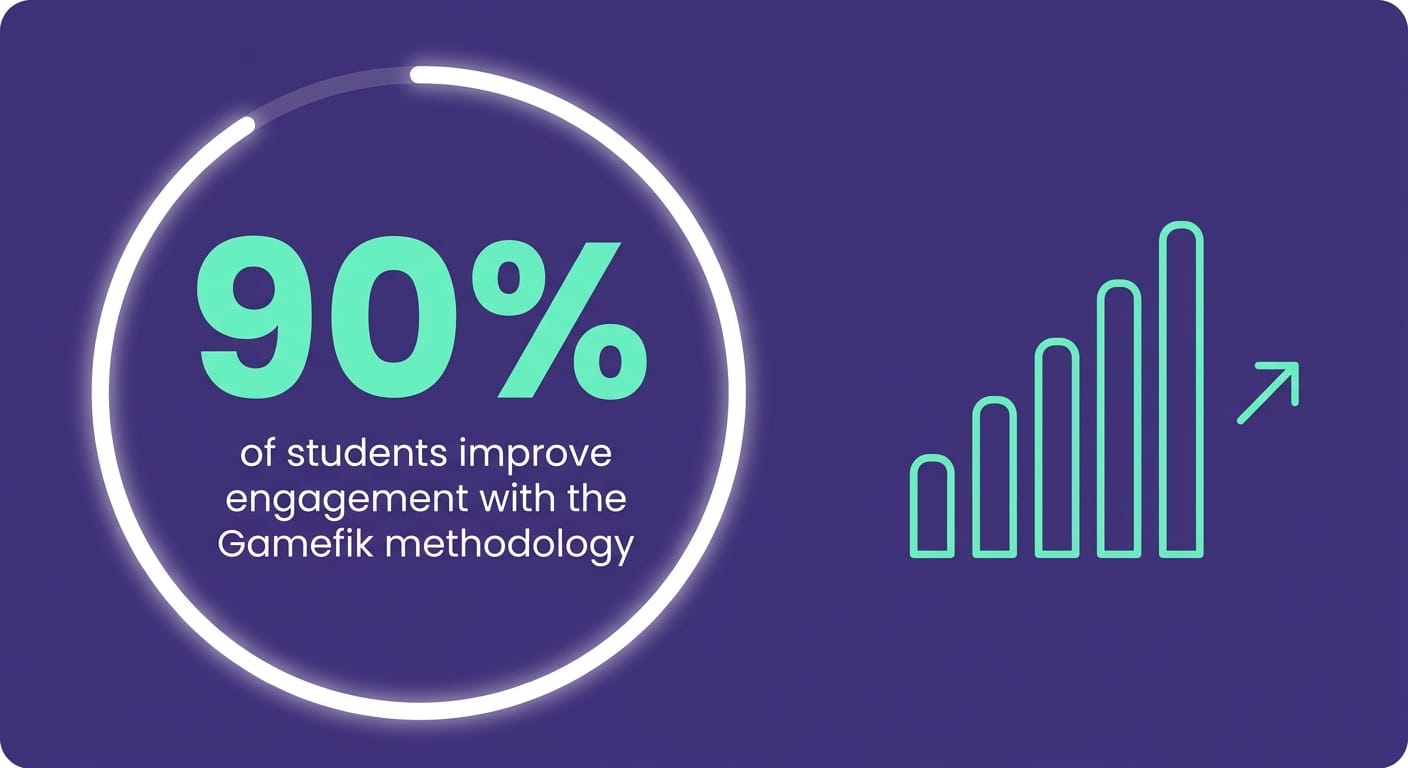
The results from our partner schools confirm the impact: in our 2024 internal research across 500+ schools in Brazil and LATAM, 90% of students improved their engagement when gamification in education was applied in a structured way. And engagement is the leading indicator for all the others — when it rises, attendance follows, and grades follow after that.
With more than 500 partner schools and 100,000 students already benefiting across Brazil and LATAM — and a growing footprint in North American and UK institutions — we see the same pattern repeat: schools that treat engagement as a management metric, not a feeling, retain more students. Implementation takes less than one week, and AI for teachers gives staff back an average of 2 hours per week — time that can be redirected to exactly the kind of human retention conversations that happen in Step 2 and make the decisive difference.
To be transparent: technology does not replace the human work of reaching out to an at-risk student or making that call to a parent. It frees up the time and visibility for that work to happen at the right moment. In schools where the leadership team does not own the human side of the protocol, no platform alone will hold a student's enrollment.
Frequently Asked Questions About Reducing Student Dropout
What is an effective action plan to prevent student dropout? An effective dropout prevention plan has 5 steps: diagnosis using measurable indicators (attendance, grades, engagement), structured outreach to families, an individual intervention plan for each at-risk student, pedagogical re-engagement strategies, and bi-weekly progress monitoring. The key differentiator is setting success metrics for each step — not just executing isolated actions.
What are the top 5 reasons students drop out of school? The five most common causes are: socioeconomic pressures (needing to work), disengagement and lack of connection to course content, accumulated learning gaps, structural barriers such as transportation or school safety issues, and mental health or family challenges. Dropout is rarely caused by a single factor — it is typically the result of multiple warning signs ignored over time.
How can schools proactively reduce dropout rates? The most effective strategy is replacing reactive responses — acting after a student has already disengaged — with early prevention: building a continuous monitoring system for attendance and engagement that triggers alerts when students cross risk thresholds, enabling intervention weeks before any formal withdrawal occurs.
What role do district policies play in reducing dropout? District and state-level policies create the structural conditions — funding for counselors, early warning data systems, transportation equity, and access to mental health resources — that make school-level retention strategies viable. Schools complement these policies with localized diagnostics and the kind of individual outreach that no district office can execute at the student level.
Conclusion: Start With a List of Names, Not a Policy Statement
Reducing student dropout is not a motivation problem — it is a method problem. Your school already has the data. What is missing is the framework to connect it and the protocol to act before a student disappears from the roster.
Start this week with Step 1: pull the list of students triggering two or more indicators. That single action already puts you ahead of the majority of schools, which only discover dropout after it has already happened.
If you want to turn this monitoring into something continuous and automatic, see how Gamefik helps 500+ schools keep engagement — and retention — under control at gamefik.com.